






The stark recent findings on the lasting damage we’ve caused to the planet has sparked calls for urgent planet action and for us all to do our bit for the environment.
From obvious and simple things such as turning appliances off instead of leaving on standby, right through to big lifestyle commitments such as reducing meat consumption or going vegan, the possibilities are endless. One thing we can do which we are all very much aware of and have tried in one way or another, with nearly 90%[1] of us considering it an established norm, is recycling.

Why is Recycling Important?
Recycling is important because it gives existing materials a new life, instead of relying on and depleting natural resources. Recycling also uses considerably less water and 75%[2] less energy during manufacturing, as well as emitting less pollution compared to harvesting and creating using raw materials.
So, without further ado, let’s see which local authorities are recycling royalty, and which are seriously struggling:
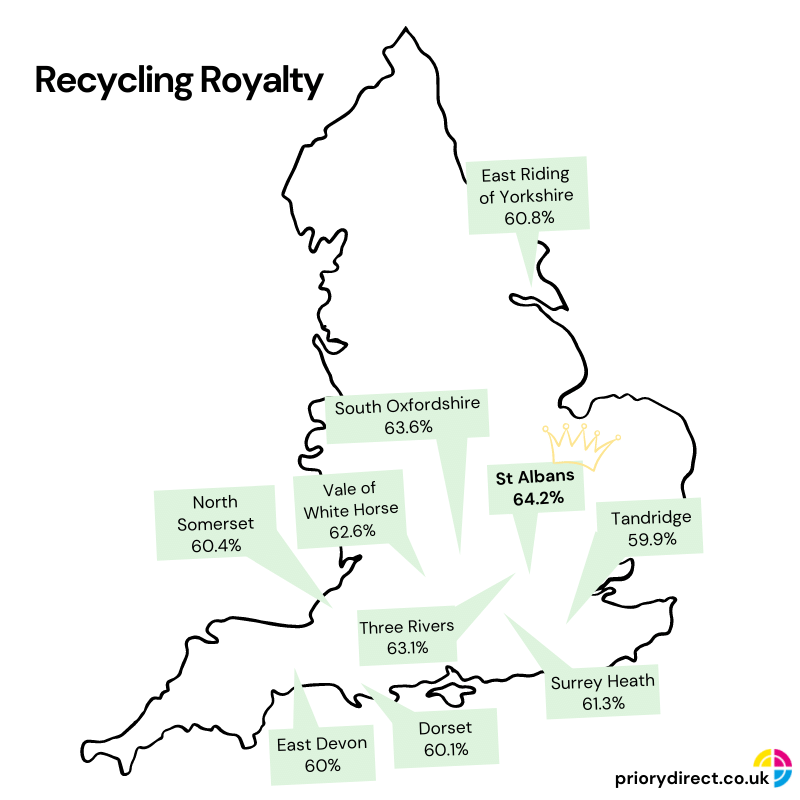
The Leaders
| Position | Local Authority | % Recycling Rate |
| 1 | St Albans | 64.2% |
| 2 | South Oxfordshire | 63.6% |
| 3 | Three Rivers | 63.1% |
| 4 | Vale of White Horse | 62.6% |
| 5 | Surrey Heath | 61.3% |
| 6 | East Riding of Yorkshire | 60.8% |
| 7 | North Somerset | 60.4% |
| 8 | Dorset | 60.1% |
| 9 | East Devon | 60% |
| 10 | Tandridge | 59.9% |
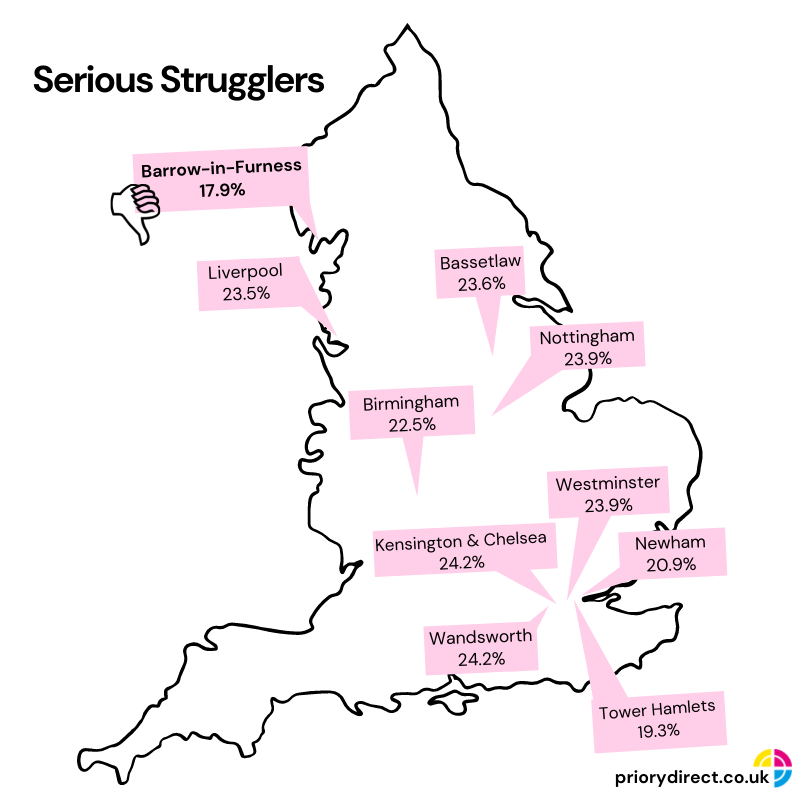
The Losers
| Position | Local Authority | % Recycling Rate |
| 1 | Barrow-in-Furness | 17.9% |
| 2 | Tower Hamlets | 19.3% |
| 3 | Newham | 20.9% |
| 4 | Birmingham | 22.5% |
| 5 | Liverpool | 23.5% |
| 6 | Bassetlaw | 23.6% |
| 7 | Westminster | 23.9% |
| 8 | Nottingham | 23.9% |
| 9 | Wandsworth | 24.2% |
| 10 | Kensington & Chelsea | 24.2% |
Lifting The Lid
You don’t need to be a statistician to see the difference between St Albans and Barrow-in-Furness is vast. The question we need to be asking here is how can this happen?
In England, recycling and waste is managed by local councils instead of any centralised laws or guidance set by the government – the extent of the government’s involvement is setting a target percentage of waste to be recycled. But with no penalties if you fail to meet the target, and no extra funds for those councils that are falling behind, there’s no pressure and no accountability, so you end up with some local authorities taking it very seriously, and some who have different priorities and consequently let it slide down their to-do list.
Environmental commitments continue to be brandished around but it doesn’t install much confidence when the national average for recycling was down to 42.3% from 43.8% in the previous year with the decrease being blamed, like many things, on the impact of the pandemic. (We’re not sure how that adds up either…)
When we delved a little deeper into the league tables, we were expecting to find that the likes of St Albans and South Oxfordshire were simply offering more extensive recycling collection than Barrow-in-Furness or the five London boroughs making up the worst 10.
In actual fact, Barrow-in-Furness collects more materials than St Albans, with their pick-ups including the tricky food and drink cartons.
So, if the offering is the same, why such disparity in their recycling rates? St Albans City & District Council say they’ve increased communications around their weekly battery recycling collection – but this surely isn’t the only answer to their 259% better recycling performance.
Attitude and approach come into it – and I imagine it’s also due to perception. St Albans have two recycling bins – one for paper and cardboard, and one for mixed recycling (plastics, cans, foil, and glass). However, in Barrow-in-Furness, there’s one recycling bin for every material. There’s bound to be scepticism over if the recycling will actually happen – are lorries worth of 5+ materials in mixed recycling really going to be sorted? In trying to simplify the recycling process, it may be causing more issues as it instead could be generating a “why bother” feeling.
How Good Is My Local Area At Recycling?
Want to know how your local area faired out of the 338 local authorities in the league table? Well wonder no more – we’ve split the results into regions so you can quickly and easily find out.
North East England
| National Position | Local Authority | % Recycling Rate |
| 63 | North Lincolnshire | 51.9% |
| 188 | Newcastle-upon-Tyne | 40.6% |
| 228 | County Durham | 37.3% |
| 239 | North Tyneside | 36.2% |
| 252 | Darlington | 35.1% |
| 267 | Northumberland | 33.4% |
| 278 | Gateshead | 32.3% |
| 294 | South Tyneside | 30,8% |
| 299 | Hartlepool | 30.1% |
| 311 | Sunderland | 28.1% |
| 328 | Stockton-on-Tees | 24.3% |
North West England
| National Position | Local Authority | % Recycling Rate |
| 22 | Cheshire East | 57.5% |
| 37 | Stockport | 55% |
| 42 | Cheshire West and Chester | 54.5% |
| 53 | Trafford | 53.3% |
| 56 | Wigan | 53.2% |
| 71 | Bury | 50.5% |
| 97 | Bolton | 48.1% |
| 99 | West Lancashire | 48.1% |
| 101 | Rochdale | 48% |
| 109 | Salford | 47.2% |
| 110 | Tameside | 47.2% |
| 121 | Eden | 45.5% |
| 122 | South Ribble | 45.5% |
| 124 | Chorley | 45.1% |
| 128 | Fylde | 44.8% |
| 136 | Wyre | 44.5% |
| 139 | Warrington | 44.4% |
| 148 | South Lakeland | 43.5% |
| 180 | Carlisle | 41.2% |
| 208 | Halton | 39.3% |
| 216 | Lancaster | 38.2% |
| 231 | Oldham | 36.7% |
| 233 | Manchester | 36.6% |
| 235 | Allerdale | 36.5% |
| 242 | Hyndburn | 35.9% |
| 256 | Sefton | 34.8% |
| 259 | Ribble Valley | 34.6% |
| 261 | Copeland | 34.2% |
| 263 | Rossendale | 34% |
| 268 | Burnley | 33.3% |
| 274 | Pendle | 32.5% |
| 282 | Preston | 31.9% |
| 285 | Wirral | 31.9% |
| 288 | St Helens | 31.4% |
| 300 | Blackburn with Darwen | 29.8% |
| 305 | Knowsley | 28.7% |
| 316 | Blackpool | 27.5% |
| 334 | Liverpool | 23.5% |
| 338 | Barrow-in-Furness | 17.9% |
Yorkshire and the Humber
| National Position | Local Authority | % Recycling Rate |
| 6 | East Riding of Yorkshire | 60.8% |
| 51 | Calderdale | 53.5% |
| 74 | Hambleton | 49.9% |
| 83 | Kingston-upon-Hull | 49.2% |
| 84 | Wakefield | 49.2% |
| 94 | Ryedale | 48.3% |
| 132 | Selby | 44.7% |
| 142 | York | 44.1% |
| 151 | Doncaster | 43.4% |
| 154 | Rotherham | 43.3% |
| 155 | Barnsley | 43.2% |
| 160 | Harrogate | 42.6% |
| 200 | Craven | 39.9% |
| 210 | Richmondshire | 39.1% |
| 220 | Bradford | 37.8% |
| 225 | Scarborough | 37.5% |
| 229 | Redcar and Cleveland | 37.3% |
| 253 | Leeds | 35.1% |
| 279 | Sheffield | 32.2% |
| 307 | Middlesborough | 28.6% |
| 325 | Kirklees | 25% |
East Midlands
| National Position | Local Authority | % Recycling Rate |
| 11 | South Northamptonshire | 59.6% |
| 31 | Derbyshire Dales | 55.6% |
| 58 | Daventry | 52.7% |
| 67 | High Peak | 50.8% |
| 93 | Rushcliffe | 48.3% |
| 108 | East Northamptonshire | 47.4% |
| 111 | Harborough | 46.9% |
| 116 | South Derbyshire | 46.1% |
| 129 | Hinckley and Bosworth | 44.8% |
| 140 | Blaby | 44.1% |
| 147 | Melton | 43.5% |
| 156 | North Kesteven | 43.1% |
| 157 | Charnwood | 42.8% |
| 158 | Corby & Kettering | 42.8% |
| 161 | North West Leicestershire | 42.5% |
| 168 | West Lindsey | 42% |
| 169 | Erewash | 41.8% |
| 191 | South Kesteven | 40.4% |
| 195 | Chesterfield | 40.2% |
| 203 | North East Derbyshire | 39.8% |
| 204 | East Lindsey | 39.7% |
| 209 | Wellingborough | 39.2% |
| 224 | Broxtowe | 37.5% |
| 227 | Northampton | 37.5% |
| 232 | Derby | 36.7% |
| 236 | Ashfield | 36.4% |
| 241 | Bolsover | 36% |
| 245 | Leicester | 35.7% |
| 247 | North East Lincolnshire | 35.5% |
| 255 | Boston | 34.8% |
| 260 | Lincoln | 34.5% |
| 276 | Gedling | 32.4% |
| 277 | Newark and Sherwood | 32.3% |
| 289 | Amber Valley | 31.3% |
| 292 | Mansfield | 30.9% |
| 318 | South Holland | 27.3% |
| 331 | Nottingham | 23.9% |
| 333 | Bassetlaw | 23.6% |
West Midlands
| National Position | Local Authority | % Recycling Rate |
| 13 | Stratford-on-Avon | 59.4% |
| 21 | Staffordshire Moorlands | 57.7% |
| 39 | Warwick | 54.6% |
| 54 | Shropshire | 53.3% |
| 78 | Stafford | 49.6% |
| 91 | South Staffordshire | 48.4% |
| 96 | Telford and Wrekin | 48.2% |
| 119 | Lichfield | 45.9% |
| 126 | Rugby | 45% |
| 127 | North Warwickshire | 44.9% |
| 133 | Wychavon | 44.7% |
| 141 | East Staffordshire | 44.1% |
| 159 | Cannock Chase | 42.7% |
| 164 | Malvern Hills | 42.3% |
| 166 | Newcastle-under-Lyme | 42.2% |
| 175 | Bromsgrove | 41.6% |
| 211 | Herefordshire | 38.7% |
| 213 | Tamworth | 38.5% |
| 217 | Nuneaton and Bedworth | 38.2% |
| 221 | Solihull | 37.7% |
| 230 | Dudley | 36.9% |
| 250 | Worcester | 35.3% |
| 251 | Wolverhampton | 35.3% |
| 264 | Coventry | 34% |
| 265 | Wyre Forest | 33.6% |
| 280 | Walsall | 32.2% |
| 286 | Stoke-on-Trent | 31.7% |
| 296 | Sandwell | 30.6% |
| 315 | Redditch | 27.5% |
| 335 | Birmingham | 22.5% |
East of England
| National Position | Local Authority | % Recycling Rates |
| 1 | St Albans | 64.2% |
| 3 | Three Rivers | 63.1% |
| 18 | Rochford | 58.5% |
| 20 | Maldon | 57.9% |
| 25 | Colchester | 56.9% |
| 26 | East Cambridgeshire | 56.6% |
| 28 | North Hertfordshire | 55.9% |
| 33 | Huntingdonshire | 55.2% |
| 40 | Dacorum | 54.5% |
| 44 | Epping Forest | 54% |
| 72 | Watford | 50% |
| 77 | Cambridge City and South Cambs | 49.6% |
| 82 | Uttlesford | 49.4% |
| 85 | Broadland | 49% |
| 87 | East Hertfordshire | 49% |
| 100 | Castle Point | 48% |
| 105 | Welwyn Hatfield | 47.6% |
| 112 | Basildon | 46.5% |
| 117 | Central Bedfordshire | 46.1% |
| 120 | Braintree | 45.8% |
| 137 | Hertsmere | 44.4% |
| 146 | Southend-on-Sea | 43.7% |
| 162 | Broxbourne | 42.4% |
| 170 | South Norfolk | 41.8% |
| 174 | Brentwood | 41.6% |
| 181 | Harlow | 41.2% |
| 183 | Chelmsford | 41.1% |
| 185 | Peterborough | 40.9% |
| 187 | North Norfolk | 40.7% |
| 194 | Fenland | 40.3% |
| 197 | Stevenage | 40.2% |
| 198 | Tendring | 40.2% |
| 199 | Bedford | 40% |
| 201 | East Suffolk | 39.9% |
| 206 | Mid Suffolk | 39.5% |
| 212 | Breckland | 38.6% |
| 214 | Norwich | 38.3% |
| 218 | West Suffolk | 38.2% |
| 219 | Kings Lynn and West Norfolk | 38% |
| 272 | Ipswich | 33% |
| 301 | Luton | 29.5% |
| 302 | Great Yarmouth | 29.2% |
| 312 | Thurrock | 28% |
London
| National Position | Local Authority | % Recycling Rates |
| 73 | Bexley | 50% |
| 86 | Ealing | 49% |
| 106 | Kingston upon Thames | 47.6% |
| 118 | Sutton | 46.1% |
| 130 | Bromley | 44.8% |
| 179 | Croydon | 41.3% |
| 186 | Merton | 40.8% |
| 190 | Richmond upon Thames | 40.4% |
| 226 | Hillingdon | 37.3% |
| 237 | Lambeth | 36.4% |
| 244 | Harrow | 35.8% |
| 249 | Hounslow | 35.4% |
| 258 | Havering | 34.7% |
| 266 | Brent | 33.4% |
| 270 | Enfield | 33.2% |
| 275 | Southwark | 32.5% |
| 284 | Waltham Forest | 31.9% |
| 287 | Greenwich | 31.5% |
| 290 | Islington | 31.3% |
| 291 | Haringey | 31% |
| 298 | City of London | 30.3% |
| 304 | Barnet | 28.9% |
| 306 | Camden | 28.6% |
| 309 | Lewisham | 28.4% |
| 310 | Hackney | 28.1% |
| 314 | Hammersmith & Fulham | 27.5% |
| 319 | Barkings & Dagenham | 26.9% |
| 324 | Redbridge | 25.4% |
| 329 | Kensington & Chelsea | 24.2% |
| 330 | Wandsworth | 24.2% |
| 332 | Westminster | 23.9% |
| 336 | Newham | 20.9% |
| 337 | Tower Hamlets | 19.3% |
South East England
| National Position | Local Authority | % Recycling Rates |
| 2 | South Oxfordshire | 63.6% |
| 4 | Vale of White Horse | 62.6% |
| 5 | Surrey Heath | 61.3% |
| 10 | Tandridge | 59.9% |
| 17 | Guildford | 58.9% |
| 23 | Waverley | 57% |
| 24 | West Oxfordshire | 57% |
| 27 | Mole Valley | 56.6% |
| 30 | Cherwell | 55.6% |
| 41 | Elmbridge | 54.5% |
| 43 | Woking | 54.3% |
| 46 | Milton Keynes | 53.8% |
| 47 | Epsom and Ewell | 53.7% |
| 50 | Horsham | 53.5% |
| 52 | Isle of Wight | 53.4% |
| 55 | Reigate and Banstead | 53.2% |
| 62 | Oxford | 52.1% |
| 64 | Tonbridge & Malling | 51.6% |
| 66 | Buckinghamshire | 51.2% |
| 70 | Ashford | 50.5% |
| 76 | Maidstone | 49.7% |
| 80 | Wokingham | 49.5% |
| 88 | Runnymede | 49% |
| 89 | West Berkshire | 49% |
| 92 | Wealden | 48.4% |
| 95 | Windsor and Maidenhead | 48.3% |
| 98 | Folkestone and Hythe | 48.1% |
| 103 | Dover | 47.8% |
| 107 | Tunbridge Wells | 47.5% |
| 114 | Spelthorne | 46.4% |
| 135 | Chichester | 44.5% |
| 138 | Rother | 44.4% |
| 145 | Gravesham | 43.7% |
| 150 | Bracknell Forest | 43.4% |
| 163 | Arun | 42.3% |
| 171 | Medway | 41.8% |
| 172 | Hart | 41.7% |
| 173 | Mid Sussex | 41.7% |
| 176 | Worthing | 41.5% |
| 178 | Swale | 41.4% |
| 182 | Adur | 41.1% |
| 184 | Canterbury | 40.9% |
| 189 | Winchester | 40.5% |
| 196 | Eastleigh | 40.2% |
| 202 | Lewes | 39.8% |
| 222 | Test Valley | 37.6% |
| 234 | Sevenoaks | 36.6% |
| 238 | East Hampshire | 36.2% |
| 240 | Reading | 36.1% |
| 246 | Fareham | 35.6% |
| 254 | Thanet | 35% |
| 262 | New Forest | 34.1% |
| 271 | Havant | 33% |
| 273 | Eastbourne | 32.8% |
| 281 | Crawley | 31.9% |
| 283 | Rushmoor | 31.9% |
| 293 | Hastings | 30.8% |
| 297 | Basingstoke and Deane | 30.4% |
| 303 | Brighton and Hove | 29.2% |
| 317 | Southampton | 27.5% |
| 322 | Gosport | 26.6% |
| 323 | Slough | 26.5% |
| 326 | Portsmouth | 24.7% |
| 327 | Dartford | 24.5% |
South West
| National Position | Local Authority | % Recycling Rates |
| 7 | North Somerset | 60.4% |
| 8 | Dorset | 60.1% |
| 9 | East Devon | 60% |
| 14 | Stroud | 59.4% |
| 15 | Bath and North East Somerset | 59.2% |
| 16 | Cotswold | 58.9% |
| 19 | South Gloucestershire | 58.5% |
| 29 | Teignbridge | 55.9% |
| 34 | Torridge | 55.2% |
| 35 | West Devon | 55.2% |
| 38 | South Hams | 54.7% |
| 48 | Mid Devon | 53.7% |
| 49 | Forest of Dean | 53.6% |
| 65 | Bournemouth, Christchurch and Poole | 51.3% |
| 68 | Cheltenham | 50.7% |
| 81 | North Devon | 49.4% |
| 90 | Tewkesbury | 48.6% |
| 115 | Bristol | 46.4% |
| 131 | Oadby and Wigston | 44.7% |
| 144 | Gloucester | 43.8% |
| 165 | Wiltshire | 42.3% |
| 205 | Swindon | 39.6% |
| 243 | Isles of Scilly | 35.9% |
| 248 | Torbay | 35.5% |
| 269 | Cornwall | 33.3% |
| 295 | Plymouth | 30.6% |
| 313 | Exeter | 27.8% |
Where Can I Recycle?
If you have an item which can be recycled but you’re not sure if it can be included in your collection, or if you know it can’t go in your recycling pick-up and want to find out the closest place to drop it off, our recycling locator is for you. Simply pick the item you’re looking to recycle and enter your postcode and it’ll find the closest locations for you.
Summary
If England and the UK are going to take the climate crisis, and the role and responsibility they have seriously, this is a glaring opportunity staring them straight in the face to put right, and the benefits would speak for themselves.
By centralising recycling requirements and taking the targets more seriously, we could vastly reduce our greenhouse gas emissions – when you consider that using recycled plastic uses 75% less energy compared to virgin plastics, it could be a real game changer. It needs to be made a priority, and quickly too.
How did your council get on? Better or worse than you expected? Would you be for the government setting recycling rules, or happy to keep it at local authority level? Let us know!
Data Sources:
[1] https://www.recyclingbins.co.uk/blog/uk-recycling-statistics-2021/
[2] https://www.recyclenow.com/recycle-plastic-fantastic
Local authority recycling rate data is collected by DEFRA – https://www.gov.uk/government/statistical-data-sets/env18-local-authority-collected-waste-annual-results-tables


