






We know that the future of our planet is in our hands, and it’s up to each and every one of us to do our bit to minimise our environmental impact. There’s a whole host of ways that you can get involved; from simply turning the lights off in rooms not in use, right through to a full lifestyle change of swapping to a plant-based diet, and one of the most straightforward options is also one we can see the most benefit from – recycling.
Recycling is one of our greatest allies when it comes to facing climate change as it reuses and repurposes existing materials instead of harvesting new raw materials, so it’s a much more sustainable way of living. Not only that, but using recycled materials in manufacturing uses considerably less water, energy, and is less polluting too.
So, we know that it’s worthwhile as the statistics speak for themselves – but how does London shape up with their recycling efforts? We’ve taken a look:
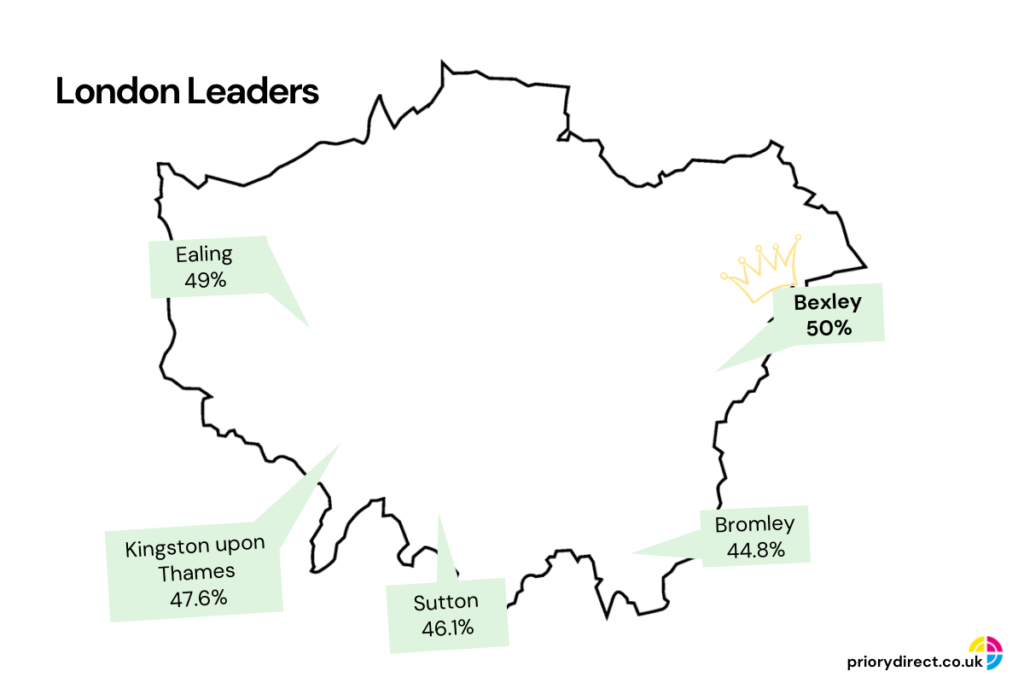
London Leaders:
| Position | Local Authority | % Recycling Rate |
| 1 | Bexley | 50% |
| 2 | Ealing | 49% |
| 3 | Kingston upon Thames | 47.6% |
| 4 | Sutton | 46.1% |
| 5 | Bromley | 44.8% |
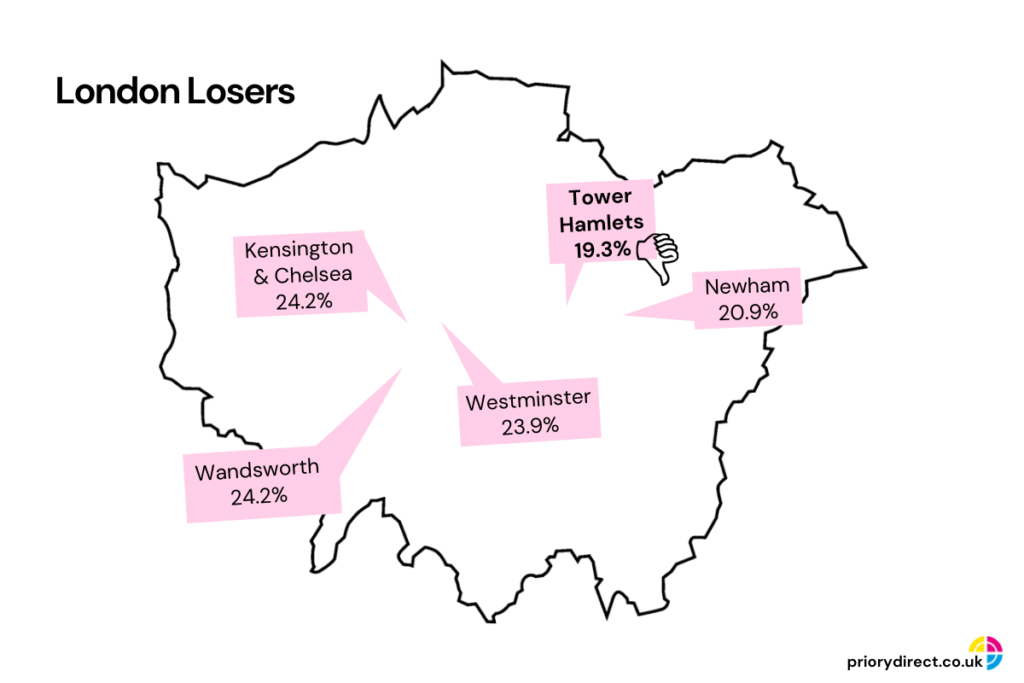
London Losers:
| Position | Local Authority | % Recycling Rate |
| 1 | Tower Hamlets | 19.3% |
| 2 | Newham | 20.9% |
| 3 | Westminster | 23.9% |
| 4 | Wandsworth | 24.2% |
| 5 | Kensington & Chelsea | 24.2% |
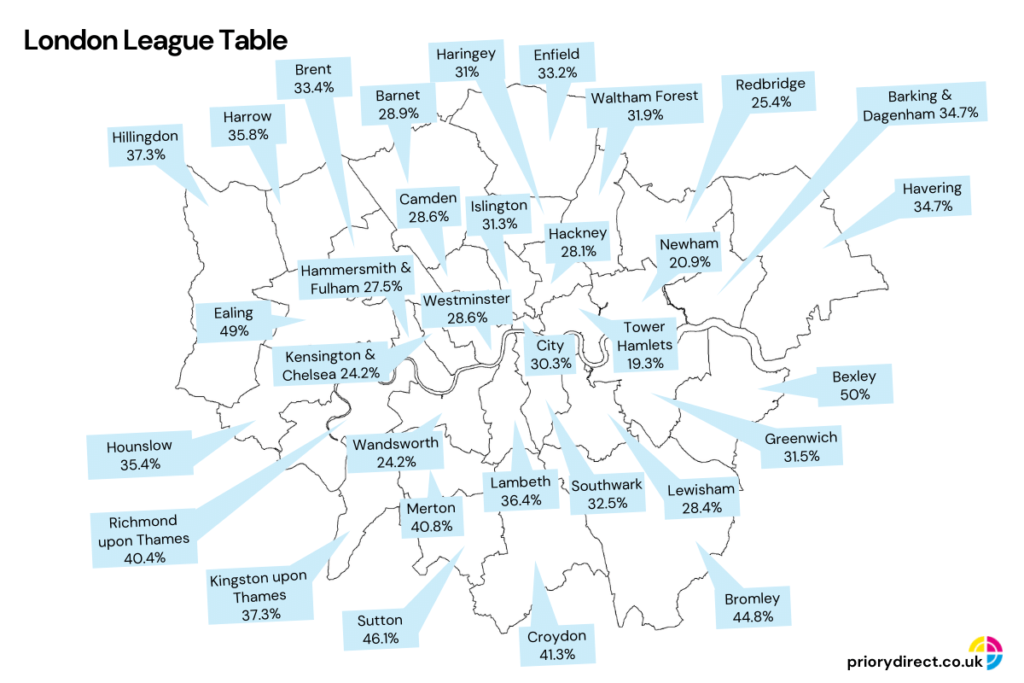
London League Table:
| London Position | National Position | Local Authority | % Recycling Rate |
| 1 | 73 | Bexley | 50% |
| 2 | 86 | Ealing | 49% |
| 3 | 106 | Kingston upon Thames | 47.6% |
| 4 | 118 | Sutton | 46.1% |
| 5 | 130 | Bromley | 44.8% |
| 6 | 179 | Croydon | 41.3% |
| 7 | 186 | Merton | 40.8% |
| 8 | 190 | Richmond | 40.4% |
| 9 | 226 | Hillingdon | 37.3% |
| 10 | 237 | Lambeth | 36.4% |
| 11 | 244 | Harrow | 35.8% |
| 12 | 249 | Hounslow | 35.4% |
| 13 | 258 | Havering | 34.7% |
| 14 | 266 | Brent | 33.4% |
| 15 | 270 | Enfield | 33.2% |
| 16 | 275 | Southwark | 32.5% |
| 17 | 284 | Waltham Forest | 31.9% |
| 18 | 287 | Greenwich | 31.5% |
| 19 | 290 | Islington | 31.3% |
| 20 | 291 | Haringey | 31% |
| 21 | 298 | City of London | 30.3% |
| 22 | 304 | Barnet | 28.9% |
| 23 | 306 | Camden | 28.6% |
| 24 | 309 | Lewisham | 28.4% |
| 25 | 310 | Hackney | 28.1% |
| 26 | 314 | Hammersmith & Fulham | 27.5% |
| 27 | 319 | Barking & Dagenham | 26.9% |
| 28 | 324 | Redbridge | 25.4% |
| 29 | 329 | Kensington & Chelsea | 24.2% |
| 30 | 330 | Wandsworth | 24.2% |
| 31 | 332 | Westminster | 23.9% |
| 32 | 336 | Newham | 20.9% |
| 33 | 337 | Tower Hamlets | 19.3% |
The Lowdown
The national league table doesn’t paint a pretty picture for London local authorities. With just two featuring in the top 100, and a staggering twenty-five appearing in the bottom 100, there’s a lot to be improved upon – not to mention the fact that 50% of the 10 worst performers in the country are in London.
When you consider that St Albans, who came out on top in the national standings, offer the exact same materials in their collections as Tower Hamlets, it does make you wonder how they achieved a recycling rate which is over three times better.
Currently in England, recycling is managed entirely by local authorities – the government only get involved to set a target, on average, across the country. There are no penalties for if and when local authorities don’t hit the target, neither is there extra funding or support given.
And when you consider such bold environmental claims and targets get set by the government who are speaking on a national level, they need to step up here too. Realistically, the only way we’re going to see improvement across the board is if national guidelines and legislations are put in place.
Across England, the average recycling rate fell from 43.8% to 42.3%, with the reduction blamed on the pandemic. Recycling represents such a big opportunity which we’re only going to see the benefit from if it’s taken seriously.
How did your local authority get on? Better or worse than you thought? Is there more you could do with your recycling efforts, or do you think the council need to provide a better, more comprehensive service? Let us know!
Data Sources
Local authority recycling rate data is collected by DEFRA – https://www.gov.uk/government/statistical-data-sets/env18-local-authority-collected-waste-annual-results-tables


