
We know that we need to take climate action to minimise long-lasting environmental damage, and it happens that one of the easiest and most widely adopted is also one which makes a big difference collectively.
We’re talking about recycling. Separating your waste may seem like an unnecessary chore, but recycling is crucial for our futures as it reduces reliance and need for virgin materials and instead to re-use and re-purpose what already has been made. And when you consider that using recycled plastic in manufacturing uses 75% less energy compared to raw materials – we’re now at a stage where we can’t afford to not use recycled materials, and to do that, we need individuals to play their part in making sure their waste goes to the right place.
So, a county widely referred to as the garden of England would surely take their responsibility for preserving our planet seriously, right? Well, not entirely. We’ve taken a look at how the county performed to see who came out on top, and who was bringing up the rear:
Top Three:
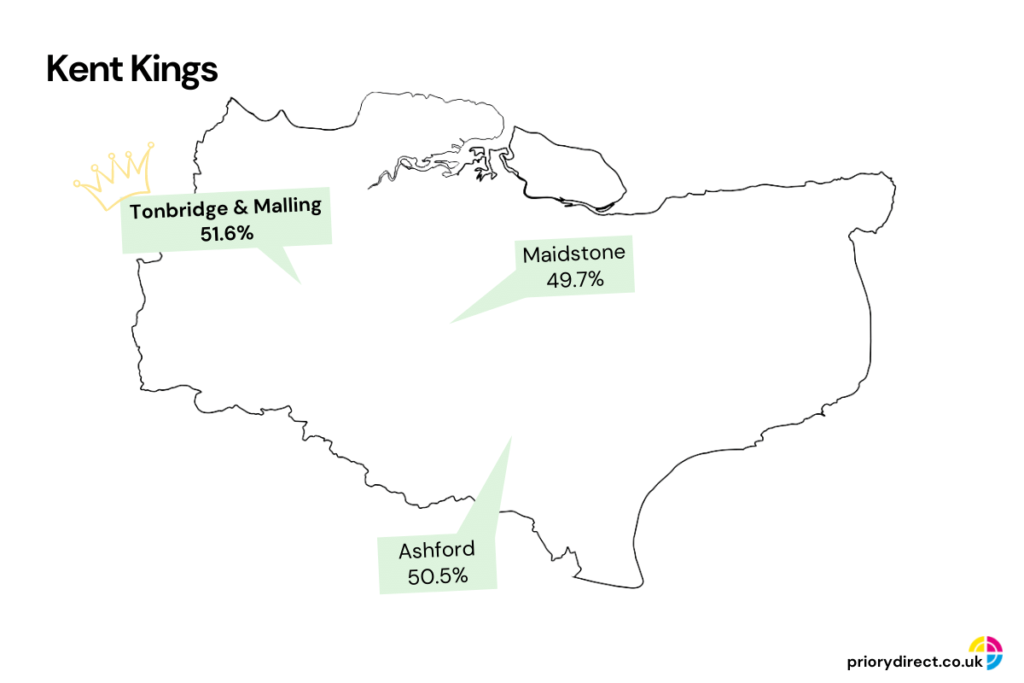
| Position | Local Authority | % Recycling Rate |
| 1 | Tonbridge & Malling | 51.6% |
| 2 | Ashford | 50.5% |
| 3 | Maidstone | 49.7% |
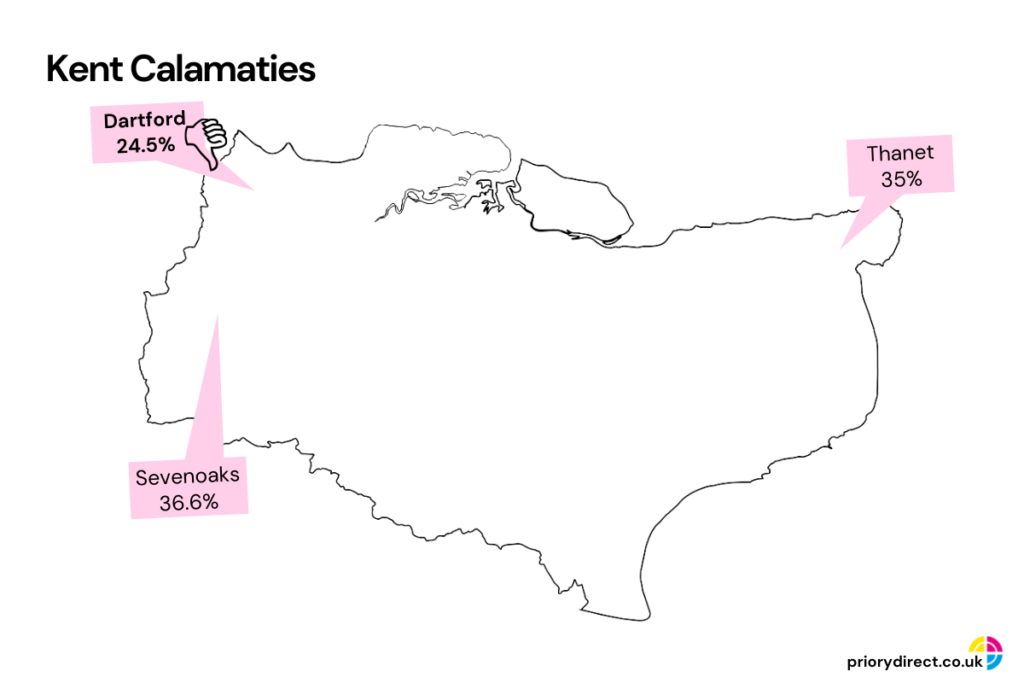
Trailing Three:
| Position | Local Authority | % Recycling Rate |
| 1 | Dartford | 24.5% |
| 2 | Thanet | 35% |
| 3 | Sevenoaks | 36.6% |
Kent League Table:
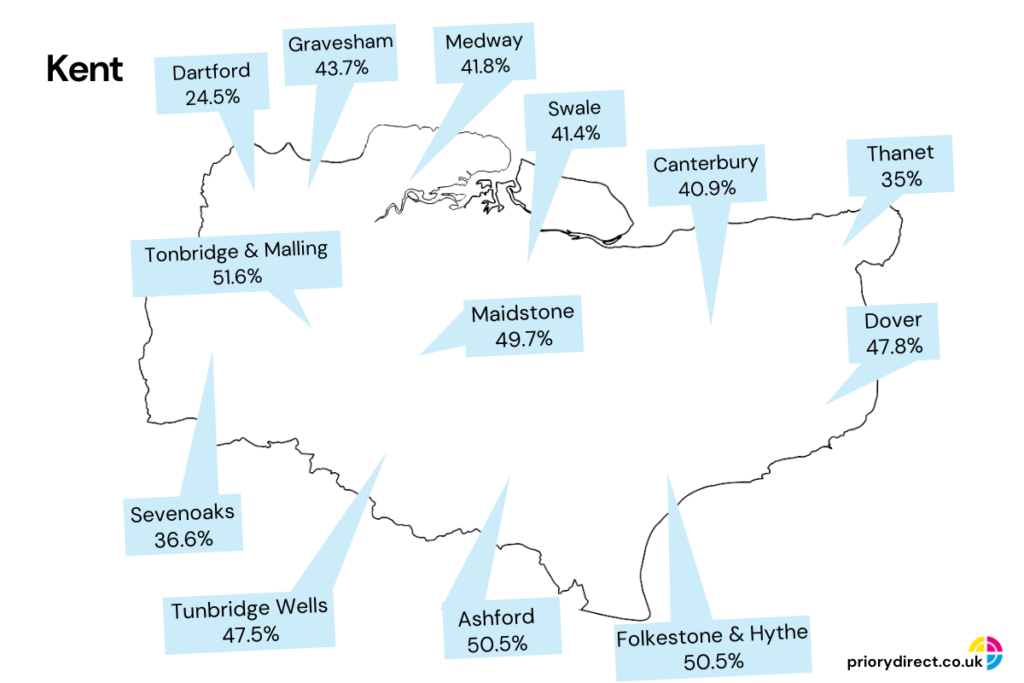
| Kent Position | National Position | Local Authority | % Recycling Rate |
| 1 | 64 | Tonbridge & Malling | 51.6% |
| 2 | 70 | Ashford | 50.5% |
| 3 | 76 | Maidstone | 49.7% |
| 4 | 98 | Folkestone & Hythe | 48.1% |
| 5 | 103 | Dover | 47.8% |
| 6 | 107 | Tunbridge Wells | 47.5% |
| 7 | 145 | Gravesham | 43.7% |
| 8 | 171 | Medway | 41.8% |
| 9 | 178 | Swale | 41.4% |
| 10 | 184 | Canterbury | 40.9% |
| 11 | 234 | Sevenoaks | 36.6% |
| 12 | 254 | Thanet | 35% |
| 13 | 327 | Dartford | 24.5% |
Kent Conclusions
Whilst there’s only around 20 miles between them, the difference between Tonbridge & Malling compared to Dartford is worlds apart. You may think that the reason behind Tonbridge & Malling has double the recycling rate compared to Dartford is because they collect more items – but they actually collect the same, so where and how does it go so wrong?
A similarity we noticed between Dartford and Barrow-in-Furness, who were the worst for recycling in England, is that paper, cardboard, plastics, and tins all go into the same bin, whereas Tonbridge & Malling collect paper and cardboard separately to plastics and tins. Could it be that perception has a big role to play here? How likely and easy is it for recycling centres to separate what’s paper and what’s plastic and what’s metal? Are households conscious of that and think their efforts would go to waste anyway so just don’t bother? It’s certainly likely.
Whatever the reason may be, it’s clear that something needs to happen to close the rates gap – and it’s not just a problem in Kent. When you look at the national recycling league table and see position 1 has a recycling rate of 64.2%, compared to 338th position with just 17.9%, we need change.
Currently in England, recycling is managed on a local authority level which leads to the huge disparities we’ve seen in this latest data. Currently the government only get involved to set a target for the country which local authorities work to achieve on average, but that’s as far as it goes. There are no penalties for not hitting the target, there’s no additional funding for those who have no option but to prioritise other causes.
As a nation we missed the target that was set, recycling just 42.3% of waste, which is even less than we did in the previous year with the cause put down to the pandemic and that’s it – it’s simply not being taken seriously anywhere as enough as it should be, and it doesn’t make you feel optimistic for the larger environmental commitments which the government have promised either.
There was backlash following the statements made at COP 26 in Glasgow last year saying they weren’t going far enough and that no actionable plans were set about. Recycling may seem like an established norm for us, but the results don’t add up. It represents such an opportunity for us and is an easier and more achievable goal to have in comparison to net zero, so we need to see action, and fast.
How did your area get on? Better or worse than you thought? Do the results inspire you to make more of an effort? Let us know!
Data Sources
Local authority recycling rate data is collected by DEFRA – https://www.gov.uk/government/statistical-data-sets/env18-local-authority-collected-waste-annual-results-tables


